
Overview
Hex is a collaborative data platform that combines analytics and data science into a single integrated environment. It allows teams to explore, analyze, and visualize data using SQL, Python, and no-code tools. The platform is designed to provide trusted data insights to anyone in a business, from advanced analysts to casual users asking simple questions. It features agentic data notebooks that can automate analysis tasks, like pulling sales data by product line and region.
Application scenarios
Revenue analysis
Users can query and visualize sales data across product lines, regions, and customer sectors, as shown with NexaCorp's galactic revenue insights.
Data exploration
Teams can interact with data through natural language questions, such as "Can you show me NexaCorp's Q3 sales by product line?".
Cross-region comparison
The platform can break down performance by region (e.g., Core Worlds, Mid-Rim, Outer Rim) and display results in grouped bar charts.
Customer sector analysis
Users can analyze revenue distribution by customer sector (e.g., Defense) to understand market segments.
Trend tracking
The platform supports comparing revenue trends over multiple quarters (e.g., Q1-Q3) to identify patterns.
Collaborative reporting
Teams can share and publish apps built from notebooks, enabling organization-wide access to insights.
Core features
Agentic data notebooks
Users can ask natural language questions, and the platform autonomously searches data sources, writes SQL or Python code, and generates visualizations—like creating charts for revenue by product line.
SQL and Python cells
The platform supports writing SQL queries and Python code directly in notebooks for custom data manipulation and analysis.
No-code tools
Users can interact with data without writing code, making analytics accessible to non-technical team members.
App builder and sharing
Users can build and publish interactive apps from their notebooks, allowing others to explore data without needing to edit the underlying code.
Semantic model integration
The platform uses endorsed semantic models (e.g., "NexaCorp: Galactic Sales Model") to standardize data definitions and pre-calculate metrics for consistent analysis.
Visualization generation
The platform automatically creates charts (e.g., grouped bar charts, revenue trends) based on user queries or code outputs.
Multi-turn conversation
Users can ask follow-up questions (e.g., "Can you break this out by region too?") and the platform maintains context to refine analyses.
Agentic data notebooks Users can ask natural language questions, and the platfor
Agentic data notebooks Users can ask natural language questions, and the platform autonomously searches data sources, writes SQL or Python code, and generates visualizations—like creating charts for revenue by product line.
Target users
Hex is designed for data teams, including data scientists, analysts, and engineers, as well as business users who need trusted data insights without deep technical skills. It serves organizations where collaboration between technical and non-technical roles is critical, such as in revenue operations, sales analytics, and strategic planning.
How to use
To get started, visit hex.tech and sign up for a free account. Users can create a new notebook, write SQL or Python code in cells, or use the agentic interface to ask natural language questions about their data. The platform automatically searches connected data sources, runs analyses, and generates visualizations. Results can be shared as interactive apps with colleagues or published for organization-wide access.
Effect review
Hex delivers a polished, agent-driven analytics experience that bridges the gap between technical data work and business consumption. The natural language querying and automatic visualization generation shown in the demo (e.g., breaking down revenue by product line and region) suggest the platform can significantly reduce the time from question to insight. The integration of SQL, Python, and no-code tools within a single notebook interface is a practical approach for teams that need both flexibility and accessibility. While the provided text doesn't include user testimonials or performance benchmarks, the feature set indicates Hex is well-suited for organizations looking to democratize data analysis without sacrificing depth.
Frequently asked questions
What is Hex?
Hex is a collaborative data platform where teams can explore, analyze, and visualize data using SQL, Python, and no-code tools.
Who is Hex for?
Hex is designed for data scientists, analysts, and anyone working with data who needs to collaborate on analytics and data science projects.
Does Hex support Python?
Yes, Hex supports Python, allowing users to write and run Python code alongside SQL and no-code components.
Can I use Hex without coding?
Yes, Hex offers no-code tools for data exploration and visualization, making it accessible to users with limited coding experience.
Is Hex a cloud-based platform?
Yes, Hex is a cloud-based platform, so you can access it from anywhere and collaborate with your team in real time.
How does Hex enable collaboration?
Hex allows multiple users to work on the same project simultaneously, share results, and comment on each other's work, all within a web-based interface.
Launch URL
https://hex.tech/Tags
Featured recommendations

Diagrimo
alternativeTenorshare's AI text-to-image tool quickly transforms ideas into clear charts and infographics, with customization and sharing features.

Monarch
alternativeMonarch Money's financial management platform helps users track accounts, optimize spending, analyze investments, and build a personalized plan to reach their financial goals.

Cires
alternativeCires by Core Infinite is a smart money manager and budget planner for tracking income, expenses, bills, debts, savings goals, accounts, categories, and generating financial reports.

Quantase
alternativeQuantase is a free quantitative scoring platform for analyzing fundamentals, momentum, and valuation of any stock in seconds.

Spenno
alternativeSpenno is a privacy-first expense tracker by an independent developer that uses AI to scan receipts and extract every line item. It tracks bills, income, taxes, and spending in one app, with a free ti

Vortex Analytics
alternativeVortex Analytics by Vortex is an AI-powered analytics platform for video games and software products, offering real-time tracking, customizable widgets, and dashboards to transform raw data into actio

Snowflake
alternativeDecisionBox integration for Snowflake, enabling seamless data connectivity and analytics workflows within the Snowflake cloud data platform.

Arithlab AI
alternativeArithlab AI by Arithlab lets you analyze spreadsheets, clean data, and get instant AI insights. Upload CSV or Excel files and chat with your data in plain English.
Related Toolkits
 Office / Data analysis
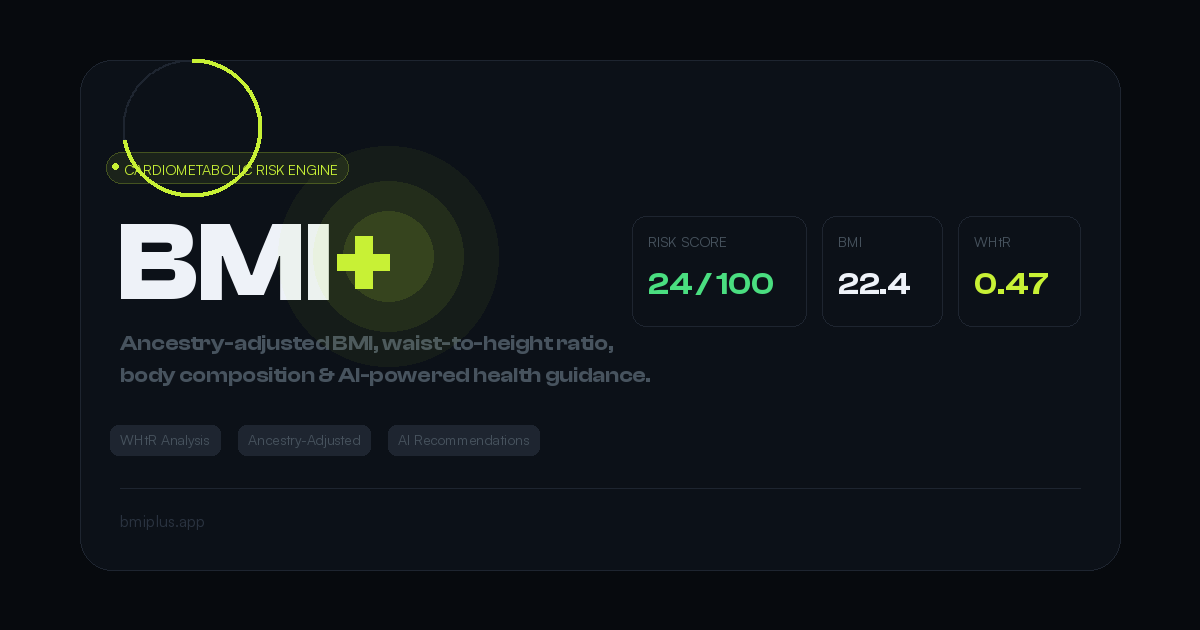
BMI+
BMI+ by Mahembega is a free cardiometabolic risk engine offering ancestry-adjusted thresholds, waist-to-height ratio analysis, body fat estimation, and AI health recommendations beyond standard BMI.
View Details Office / Data analysis
DataPallas
DataPallas is a modern BI and integrated data platform by DataPallas, offering AI-driven data exploration, dashboards, and pixel-perfect report generation, replacing tools like Looker, Tableau, and Cr
View DetailsOffice / Data analysisSpenno
Spenno is a privacy-first expense tracker by an independent developer that uses AI to scan receipts and extract every line item. It tracks bills, income, taxes, and spending in one app, with a free ti
View Details